Mooloolaba, QLD
By Lauren McCaleb · Reviewed by Dylan Duncan ·
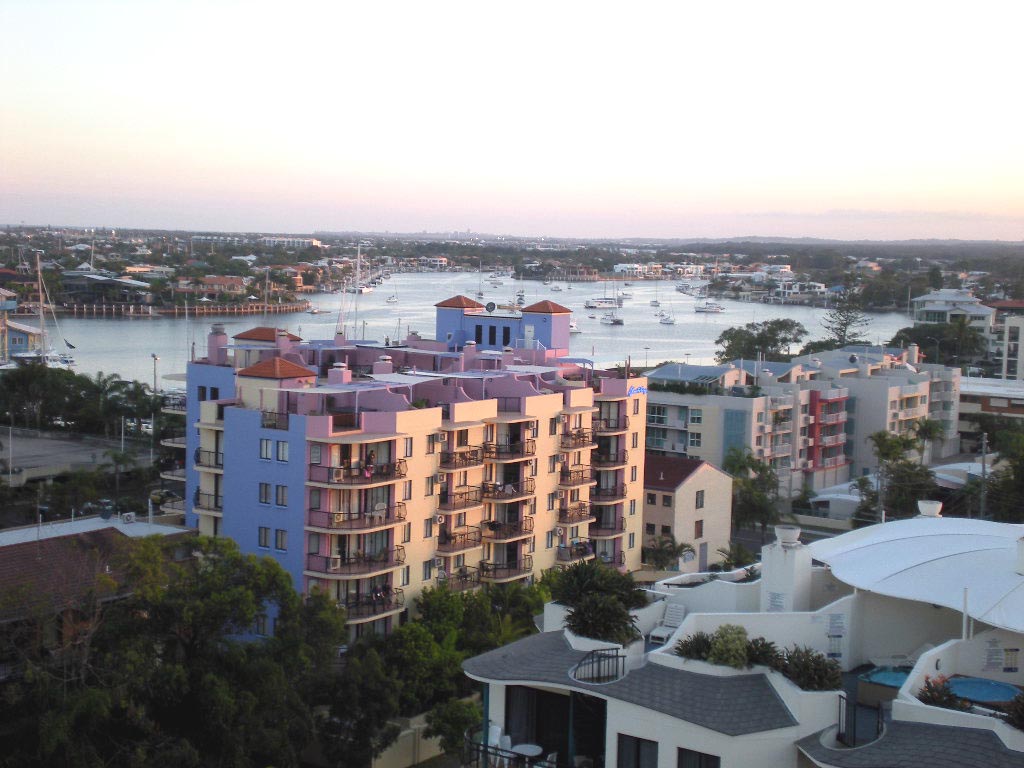
Mooloolaba is a popular beachside suburb on Queensland's Sunshine Coast, just south of Maroochydore and around 95 kilometres north of Brisbane. It is best known for its patrolled swimming beach, the palm-lined Esplanade of cafes, restaurants and shops, and SEA LIFE Sunshine Coast, an aquarium with an 80-metre underwater tunnel. A sheltered, all-weather harbour gives the suburb a working fishing fleet and marinas, and cruise ships sometimes anchor offshore. The locality was originally called Mooloolah Heads and was renamed Mooloolaba in 1919. Its name is said to come from an Aboriginal word — linked variously to 'mulu', meaning snapper, or 'mulla', a red-bellied black snake.
More advantaged than the national average
Mooloolaba is more socio-economically advantaged than about 62% of the 14,462 Australian suburbs we score, based on the ABS SEIFA index (raw score 1008, where about 1000 is the national average).
A socio-economic measure from ABS Census data — not a measure of how good a suburb is to live in or visit. How we calculate this.
Is Mooloolaba a good place to live?
There’s no single answer — it depends on what matters to you. So instead of one mystery number, we break it down: a transparent score on each part of life we can back with public data, and an honest “not yet” on the parts we can’t.
Below the national middle on the data we score
A weighted blend of the 2 components we can score for Mooloolaba from public data. It sits alongside — and reconciles with — the socio-economic Suburb Score above; it is a transparent read, not a complete verdict.
Socio-economic advantage
62/100More advantaged than the national average
More advantaged than the national average — the same ABS SEIFA-based Suburb Score (62/100) shown above. Income, education and occupation, as published by the ABS. · ABS SEIFA 2021
Housing affordability
20/100Less affordable than the national median
Median weekly rent was $400 at the 2021 Census — more affordable than about 20% of suburbs we can compare. Housing data only, no valuations. · ABS Census 2021
Not yet scored
We’d rather leave these open than publish a number we can’t stand behind. Here’s where each one stands.
- Amenities & accessNot scored yet — our OpenStreetMap amenity mapping is still rolling out across suburbs.
- Green spaceNot scored yet — our OpenStreetMap green-space mapping is still rolling out across suburbs.
- TransportNot scored yet — our OpenStreetMap public-transport mapping is still rolling out across suburbs.
- SchoolsNot scored yet — school performance (ACARA / ICSEA) needs a data-reuse licence cleared before we can publish it.
- SafetyNot scored yet — Australia has no single open crime dataset and safety data carries defamation and legal care, so it is gated pending a go/no-go and will be data-only when added.
- CommunityNot scored yet — we won't reduce community to a number from a proxy. We'd rather leave it open than publish an invented value judgement.
A transparent read on public data, not a verdict — and not a measure of any person or community. See our methodology for how each component is worked out and why some aren’t scored yet.
Mooloolaba at a glance
- Population (2021)
- 8,202
- Median age
- 44
- Median weekly household income
- $1,506
- SEIFA score
- 1008
- Local government area
- Sunshine Coast
- Coordinates
- -26.6860, 153.1162
Map of Mooloolaba
© OpenStreetMap contributors · View larger map
Housing & property in Mooloolaba
What it costs to live in Mooloolaba and how residents hold their homes, from the Australian Bureau of Statistics 2021 Census.
- Median rent
- $400
- per week
- Median mortgage
- $1,762
- per month
- Owner-occupied
- 56%
- of dwellings
- Rented
- 42%
- of dwellings
The full tenure and dwelling-type breakdown is in the Mooloolaba demographics section below.
Source: ABS Census of Population and Housing, 2021. © Australian Bureau of Statistics, released under CC BY 4.0. See our methodology.
Mooloolaba demographics (2021 Census)
The figures below profile Mooloolaba using the Australian Bureau of Statistics 2021 Census; every percentage is a share of a clearly stated Census count, so each one traces back to the source. At a glance, the largest age group is mid-life (45–64) at 28% and 27% of residents were born overseas.
Age profile
| Age group | People | Share |
|---|---|---|
| Children (0–14) | 1,086 | 13% |
| Youth (15–24) | 817 | 10% |
| Young adults (25–44) | 2,231 | 27% |
| Mid-life (45–64) | 2,294 | 28% |
| Seniors (65+) | 1,772 | 22% |
Share of the 8,200 people counted by age.
Housing and households
| Tenure | Dwellings | Share |
|---|---|---|
| Owned outright | 1,151 | 33% |
| Owned with a mortgage | 813 | 23% |
| Rented | 1,454 | 42% |
| Dwelling type | Dwellings | Share |
|---|---|---|
| Houses | 1,350 | 39% |
| Townhouses & semis | 405 | 12% |
| Flats & apartments | 1,669 | 48% |
Tenure and dwelling shares are of the roughly 3,505 occupied private dwellings in Mooloolaba.
- Average household size
- 2.1 people
- Median weekly family income
- $2,007
- Median weekly personal income
- $843
Community and culture
- Born overseas
- 2,091 (27%)
- Speaks a language other than English at home
- 759 (10%)
- Aboriginal and/or Torres Strait Islander
- 154 (2%)
Work and education
- Completed Year 12
- 4,152 (60%)
- Labour-force participation
- 59.9%
- Unemployment rate
- 3.9%
- Employed full-time
- 2,200
- Employed part-time
- 1,476
Source: ABS Census of Population and Housing, 2021 (General Community Profile, by Suburb and Locality). © Australian Bureau of Statistics, released under CC BY 4.0. How we group bands and derive each share is set out on our methodology page.
Weather and climate in Mooloolaba
Based on 2014–2023 records, the warmest month in Mooloolaba is January (average daytime high around 28.4°C) and the coolest is July (around 20.4°C). The area receives roughly 1234 mm of rain across the year.
| Month | Avg high | Avg low | Rain |
|---|---|---|---|
| Jan | 28.4°C | 20.9°C | 136 mm |
| Feb | 28°C | 20.8°C | 187 mm |
| Mar | 27.4°C | 20.2°C | 171 mm |
| Apr | 24.9°C | 17.2°C | 83 mm |
| May | 22.4°C | 14.3°C | 104 mm |
| Jun | 20.5°C | 12.1°C | 62 mm |
| Jul | 20.4°C | 11.2°C | 53 mm |
| Aug | 21.8°C | 11.6°C | 42 mm |
| Sep | 23.8°C | 13.8°C | 47 mm |
| Oct | 25.6°C | 16.2°C | 118 mm |
| Nov | 27.4°C | 18.1°C | 94 mm |
| Dec | 28.2°C | 19.9°C | 137 mm |
Climate normals, 2014–2023 (Open-Meteo, ERA5 reanalysis).
Share your local knowledge of Mooloolaba
Lived here or spent time in Mooloolaba? Add a review or a quick tip. Reviews and tips are moderated before they appear.
Common questions about Mooloolaba
Is Mooloolaba a good place to live?
There's no single answer, so we score what the public data can back. On socio-economic advantage and housing affordability, Mooloolaba rates 48/100 overall (Below the national middle on the data we score). Public transport, schools and safety aren't scored yet — see our methodology for why.
What is the median rent in Mooloolaba?
At the 2021 Census, the median weekly rent in Mooloolaba was $400, and the median monthly mortgage repayment was $1,762. These are official ABS Census figures — StreetScout publishes housing data only, with no property valuations or agent referrals.
Where is Mooloolaba?
Mooloolaba is a suburb of Queensland, Australia, in the Sunshine Coast local government area.
What is the population of Mooloolaba?
At the 2021 Census, Mooloolaba had a population of about 8,202.
Is Mooloolaba an advantaged area?
Mooloolaba has an ABS SEIFA score of 1008, where about 1000 is the national average — higher scores indicate greater relative socio-economic advantage. That gives it a Suburb Score of 62 out of 100 — more socio-economically advantaged than about 62% of Australian suburbs.
What is the weather like in Mooloolaba?
Mooloolaba has average daytime highs of about 24.9°C and overnight lows of about 16.4°C, with roughly 1,234 mm of rain across the year (based on 2014–2023 climate normals).
Nearby suburbs in Queensland
More suburb guides in Queensland
Other hand-written, cited guides — browse all guides.